Graph UX Overview
Before you start working with Graph UX, it is important to understand the basic concepts, different components, and terminologies related to Graph UX.
Library
The library contains all the possible units essential to represent a machine learning workflow on a graphical canvas. You can browse through the Library by expanding directories and exploring different units.

The Library consists of the following directories:
- Connectors: contains the Input and Output connectors units for encapsulation. Refer Encapsulation - computer programming (opens in a new tab) for more information.
- Devices: contains the data collection units, such as Local microphone and Serial Capture.
- Expressions: contains the constants and expressions units. The expressions units are written in Imagimob DSL. Refer Creating custom layers or functions for more information.
- File Formats: contains different file formats and model units, such as Wave, CSV, TFLite Model, and Keras Model.
- Math: contains a wide range of math functions units listed below.
- Axial - operates on a single tensor along a specified axis.
- Element Wise - operates on each element of a tensor individually. The tensor shape is ignored.
- Multi Tensor Operand - operations with multiple tensor operands. Two or more tensors are merged.
- Quantization - fixed-point quantization.
- Meta: modifies the meta data of a tensor.
- Signal: contains the signal processing units.
- Spectral - contains units to analyze the frequency spectrum of a signal.
- Temporal - contains the units related to Time-domain functions.
- Visualization: contains Data Track and label Track units to visualize the output of the graph.
Canvas
A Canvas is an working area where you create or edit a machine learning graph to use different functionality in Graph UX. You can work on multiple canvasas, save your current one to work on the new canvas. There can be one or more instances of a single unit on a canvas.
Canvas Properties
-
Opening Canvas: Expand MyProject and double-click main.imunit to open a canvas.
-
Zooming Canvas: zoom-in and zoom-out the canvas by scrolling the wheel of the mouse.
-
Saving Canvas: Navigate to File and select Save Main.unit As to save a canvas.
Main unit (Main.imunit)

Main unit is the root unit or node that can only be executed in a project. The canvas of the main unit can contain any number of nodes and subgraphs. When you run the main unit all the active and connected graphs get executed.
Unit (.imunit)
A unit is a function or operation that can be dragged from the solution explorer and dropped on the canvas. When you drag a unit from solution explorer and drop on the canvas, the unit is called a node. There can be one or more instances (nodes) of a single unit. All the function or operation that are listed in the librray and can be dragged and dropped on the canvas are units.
Node
A node is a building block of a graph that provides one or more functions and perform computation when executed. Nodes are connected to other nodes to form a machine learning graph.

There are two types of nodes:
-
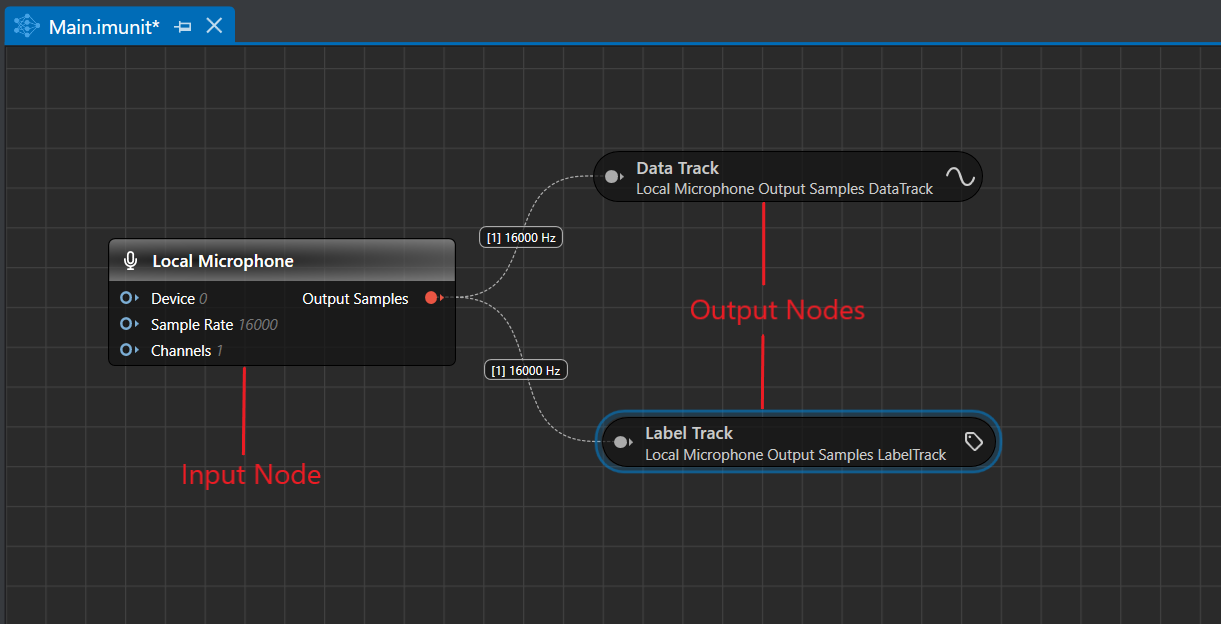
Input node
-
Output node
A Input node is designed to collect data from various external sources, such as local microphone, sensors and files and pass on the data to other nodes in the graph. These nodes are placed at beginning of the graph. A graph can have multiple input nodes but only one node active at a time.
A Output node is designed to help in visualizing the final outcome from the graph, for instance, the predictions of a machine learning model. These nodes are generally placed at the end of the graph. The output from the graph can be visualized in single or multiple output nodes.
Depending on the type, a node can have multiple Input or Output ports. The Input Ports are on the left side and the Output Ports are on the right side of Nodes, creating the flow of data from left to right.
Node Properties
-
Adding Node to Canvas: Drag a unit from solution explorer and drop onto the canvas to convert a unit into a node. There can be one or more instances of a single unit on a canvas.
-
Viewing or setting Node Properties: Click on the Node to view or set Node Properties.
-
Copy Node: Right-click on the node and select Copy and Paste a node in the graph.
-
Disabling or Enabling Node: Right-click on the node and select Disable or Enable to make a node active or inactive in a graph respectively.
-
Deleting Node: Right-click on the node and select Delete to remove a node from the graph.
Edges
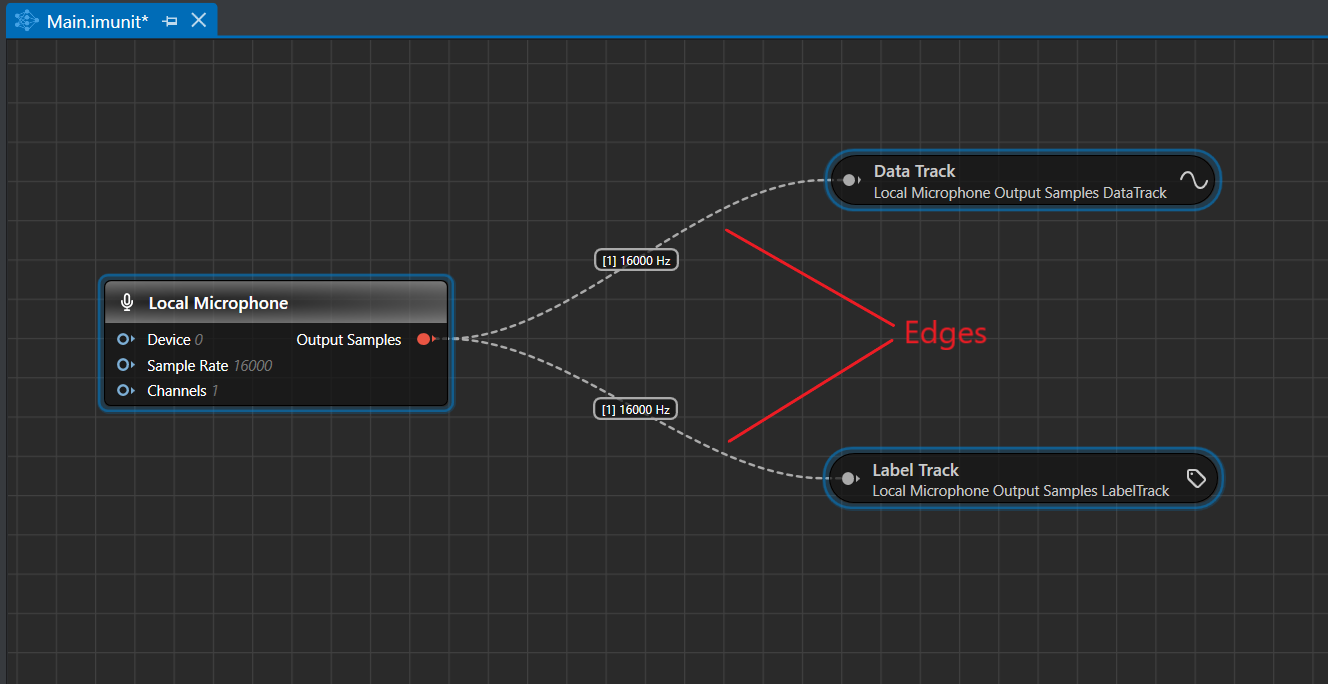
Edges are the curved lines that connects one node to another node in a graph. An edge displays the shape (within brackets '[]') and frequency, representing the data that will flow through the connection when the graph runs. If a node is connected to a node which cannot process the incoming data of the specified shape and frequency, the receiving node shows an error.

Edge Properties
- Creating Edges:Hold-and-drag the output of one node to connect to the input of another node. This creates a connection between the two nodes.
- Deleting Edges: Right-click on the edge and select Delete to remove the connection between the two nodes.
Graph
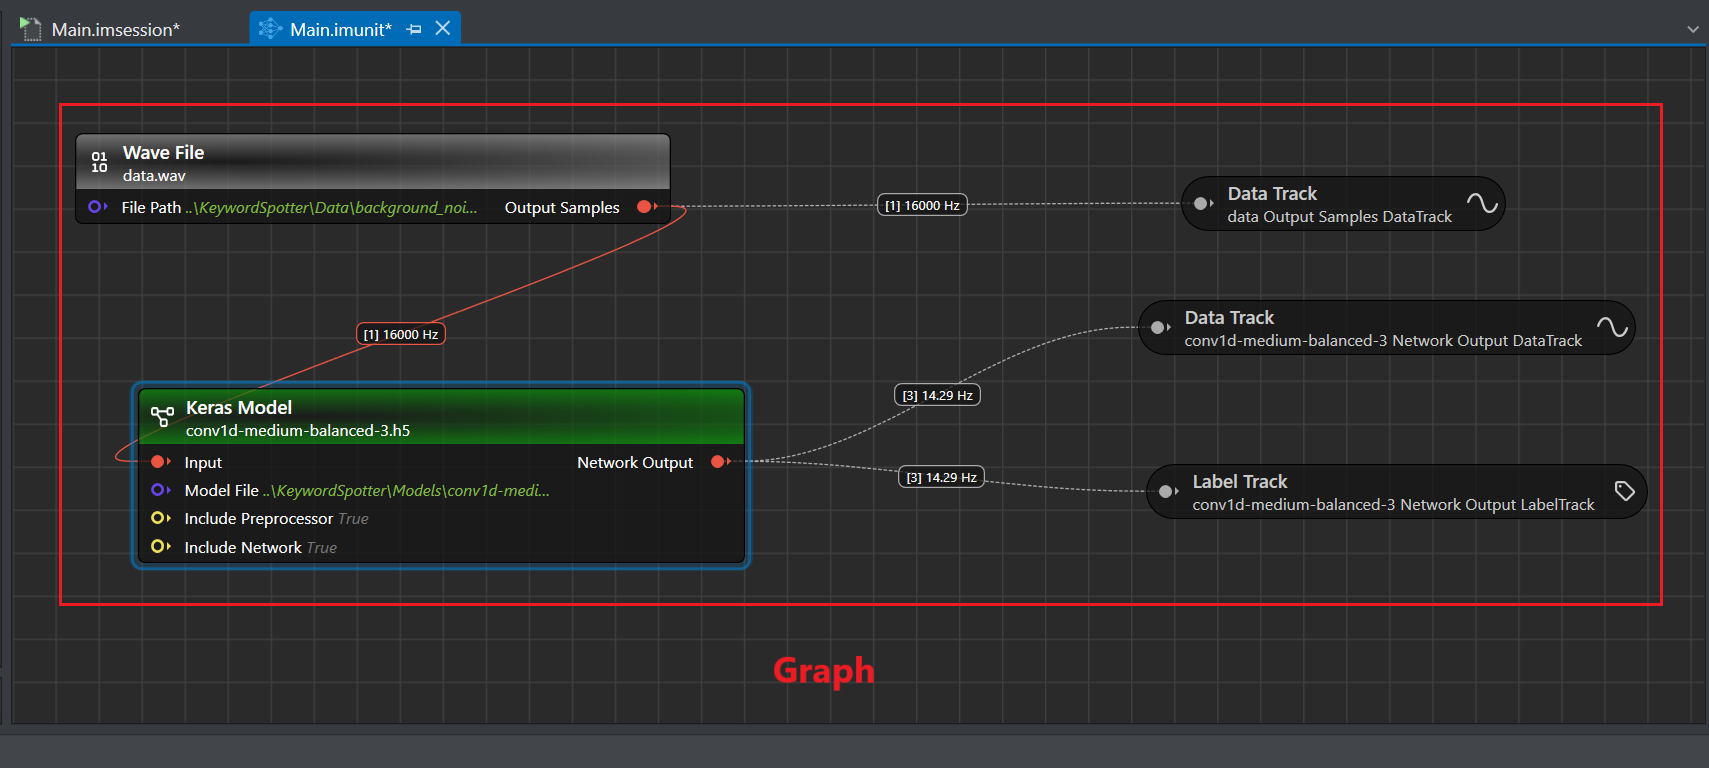
A graph is a collection of nodes and edges, where edges are the connections between the two nodes. Graphs are used to represent the end-to-end machine learning workflow in a graphical form that helps in analysing and visualization the various machiene learning components in detail. On a canvas, you can create multiple graphs layed side-by-side.

Graph Properties
- Executing Graph: Click the Start button in the toolbar to execute a graph in Graph UX.
- Generating code from a graph: Click the Generate Source Code button in the toolbar to generate the code for the graph.
Sub-graph
Sub-graph is a part of a graph that includes a subset of the nodes and the edges. A Sub-graph presents the original graph in different detailed levels.For instance, double click a trained model node in the canvas to view the sub-graph that constitutes the network.
Sub-graph Properties
-
Break graph into Sub-graph: Click the Start button in the toolbar to execute a graph in Graph UX.
-
Convert to Editable Units: Right-click on the Keras model node and select Convert to Editable Units to view the the Keras model node in detail.